Why asynchronous estimation?
Binance and Kraken do not print trades on a common clock. Hayashi–Yoshida covariance works directly with overlapping observation intervals instead of fabricating a synchronized series.
 THEO VERDELHAN - PortfolioLIVE MARKET INTERFACE
 BTC/USDT—
LATENCY—
CASE 01 · MARKET MICROSTRUCTURE
Stable BTC price discovery from Binance to Kraken from ~50 ms to ~1.95 s.
Binance BTC observations in April 2026.
Main empirical resolution.
Approximately 0.10s to 25.60s.
January, February and April 2026.
RESEARCH QUESTION
A venue can react first at sub-second horizons yet behave differently at slower adjustment scales. Synchronizing irregular trades can distort the result.
Binance and Kraken do not print trades on a common clock. Hayashi–Yoshida covariance works directly with overlapping observation intervals instead of fabricating a synchronized series.
Daubechies wavelet filters decompose lagged covariance into dyadic bands, producing a profile of immediate price discovery and slower cross-venue adjustment.
ESTIMATOR PIPELINE
The sign convention and synthetic-shift behavior are validated before any exchange result is interpreted.
Normalize public trades without forcing a shared timestamp grid.
Shift the second series over candidate lags and accumulate overlapping return intervals.
Use Daubechies coefficients and autocorrelation wavelets to isolate dyadic scales.
Select the lag maximizing absolute filtered contrast at every scale and audit stability.
EMPIRICAL EVIDENCE
Binance leads Kraken across all tested BTC scales in the core sample, while the exact magnitude remains regime-dependent.
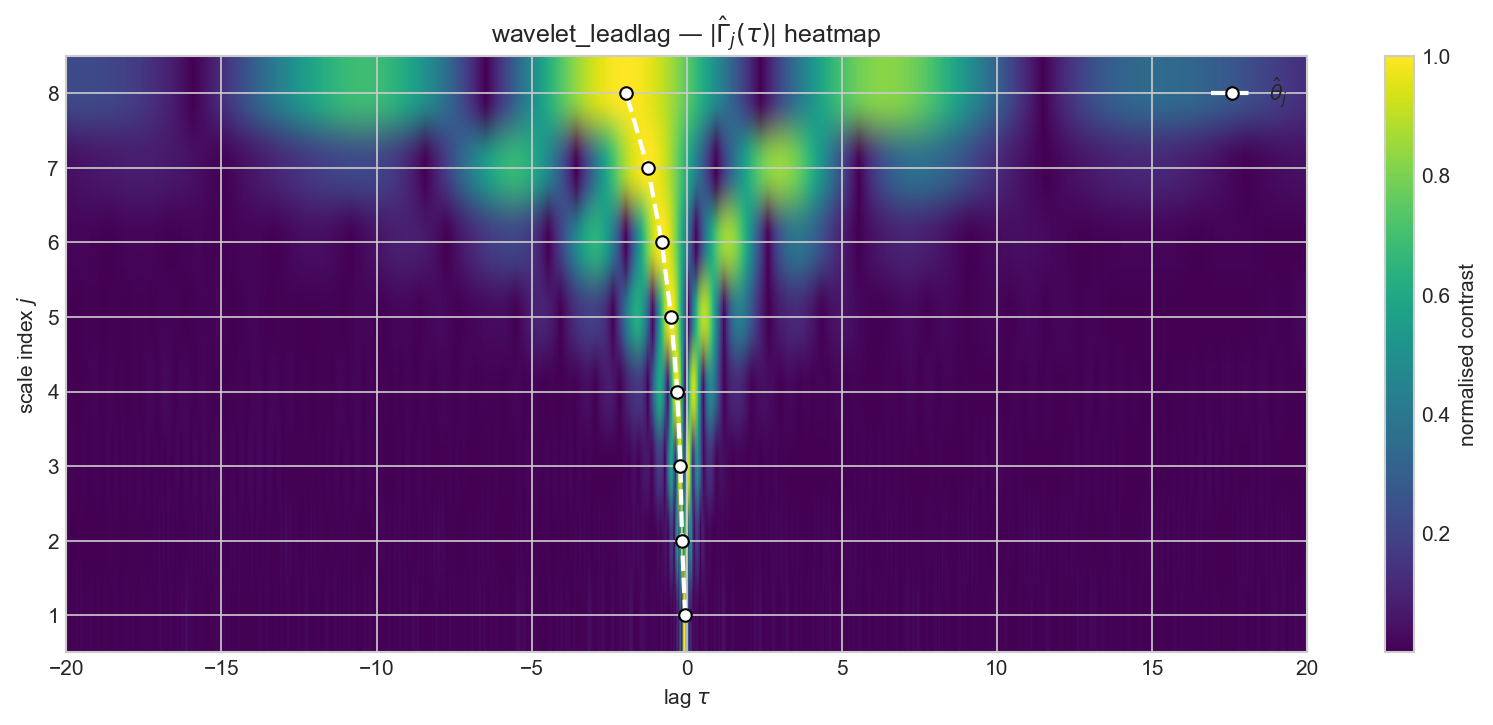
White maxima remain on the negative-lag side under the documented ordering, indicating a Binance lead over Kraken.
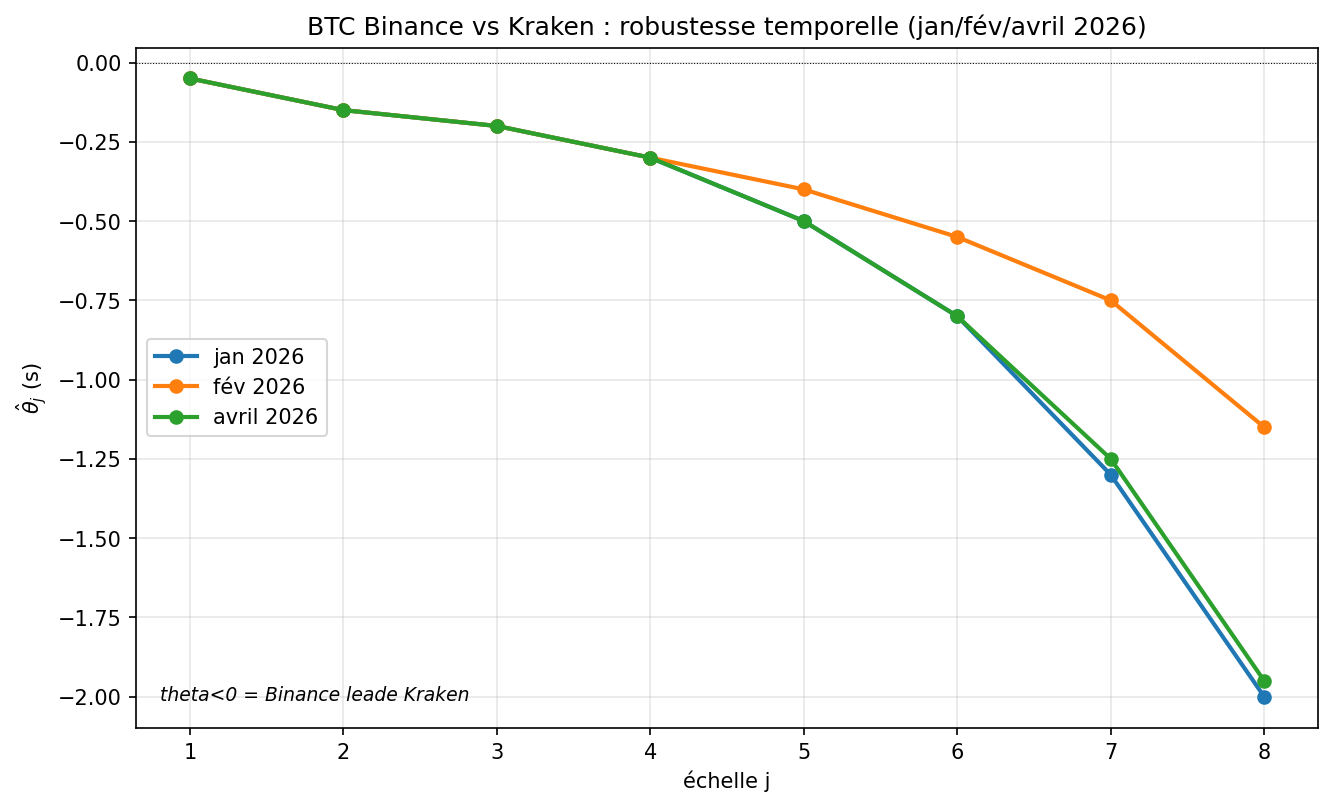
The direction survives the monthly audit; the precise lag magnitude moves with the sample.
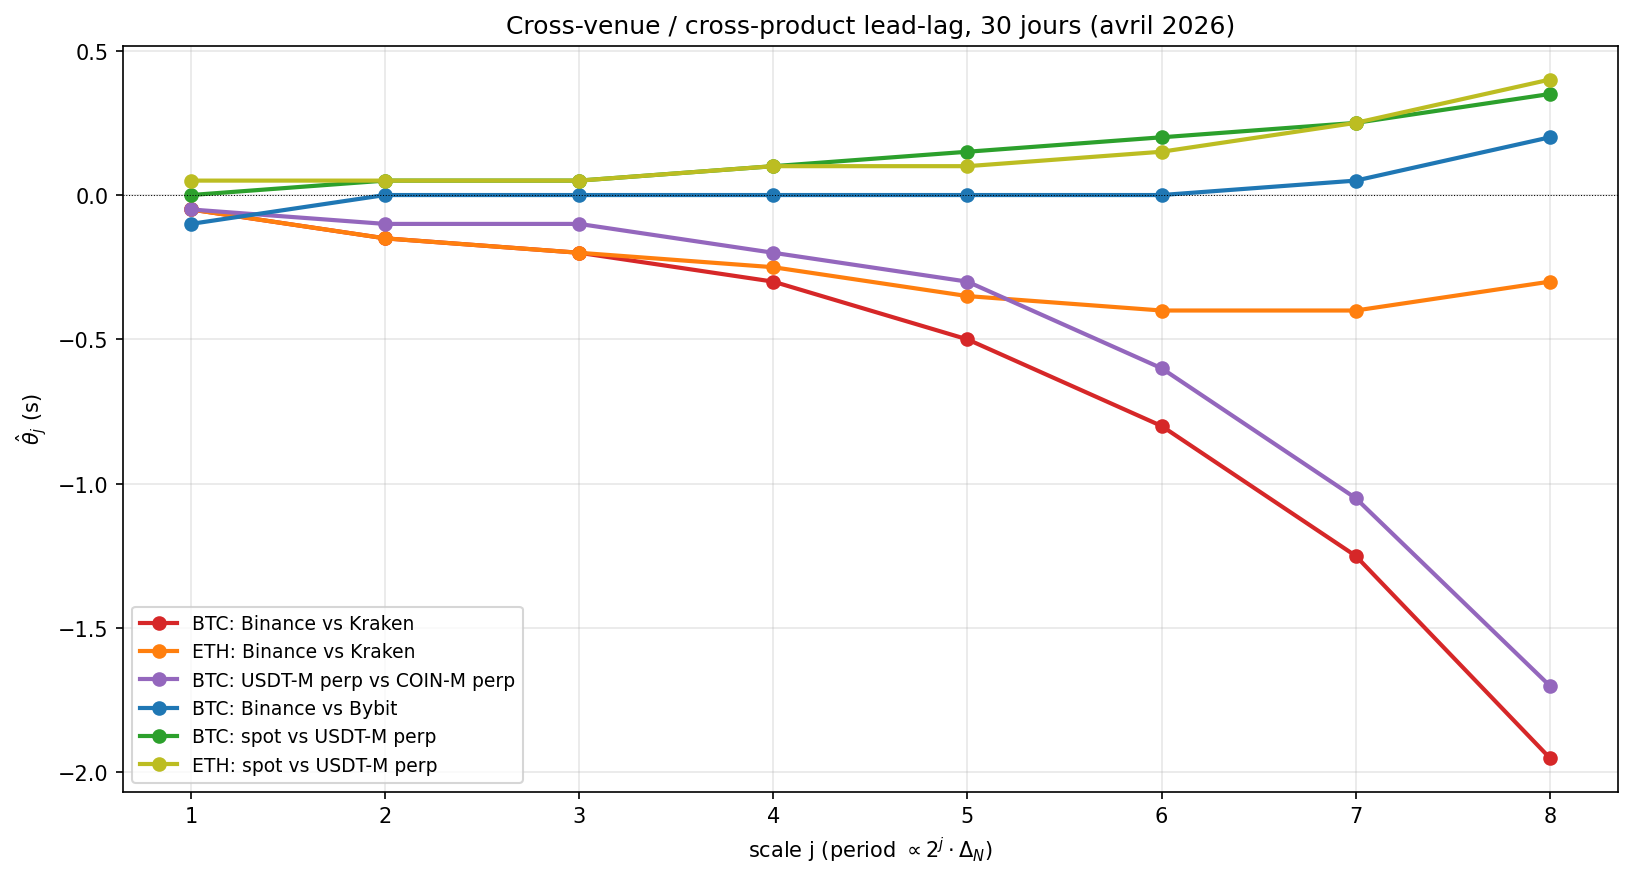
The estimator is challenged outside the headline BTC venue pair.
SIGN CONVENTION
Series 1 is written first. A negative estimate means series 1 leads series 2; a positive estimate means series 2 leads series 1. Shifted synthetic data is used before interpreting live-market samples.
LIMIT
Fees, latency, queue position, market impact and the instability of lag magnitude separate statistical price-discovery evidence from an executable strategy.