Audit
Measured balance, missingness, allocation coverage and time dependence.
 THEO VERDELHAN - PortfolioLIVE MARKET INTERFACE
 BTC/USDT—
LATENCY—
CASE 05 · FINANCIAL MACHINE LEARNING
Panel data · Chronological validation · Explainable weak-signal modeling
Allocation-time observations.
Unique financial allocations.
Anonymized timestamps.
Raw and derived features before clustering.
RESEARCH DESIGN
The objective was to predict the sign of a future allocation return. Every preprocessing step was fitted on the past before evaluation on a later validation block.
Measured balance, missingness, allocation coverage and time dependence.
Built 27 momentum, volatility, shape, trend and liquidity features.
Trained on earlier timestamps and validated only on later observations.
Benchmarked logistic regression, random forest, LightGBM and dense MLP models.
Audited feature importance and SHAP effects before final submission.
EMPIRICAL EVIDENCE
Random Forest produced the highest raw validation accuracy, while LightGBM was retained for the final submission because it preserved nearly the same score with a materially smaller train-validation gap.
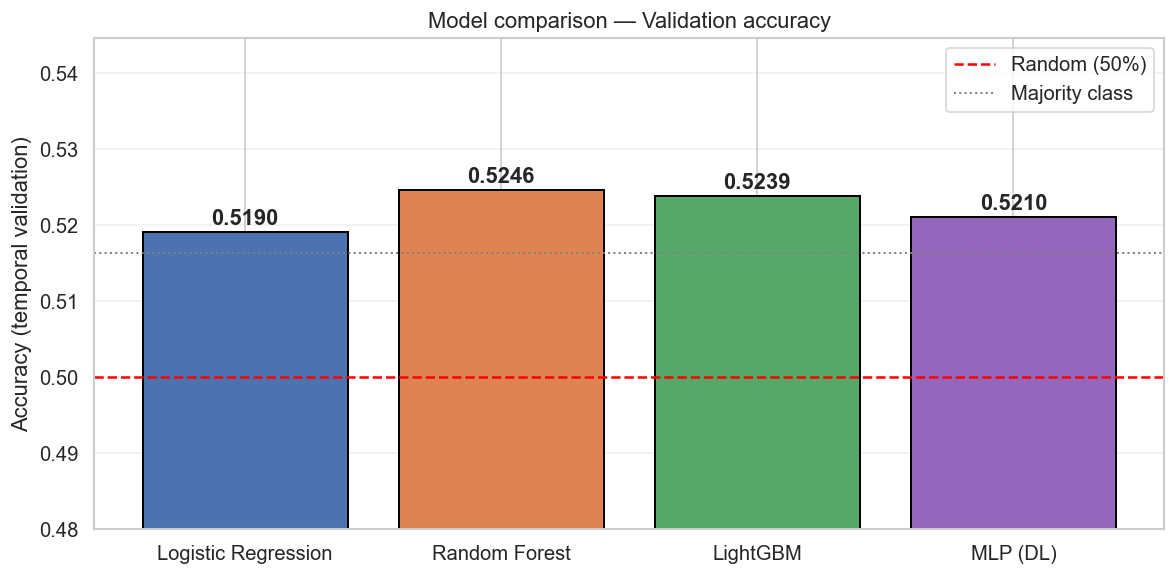
All scores use the same chronological validation split; the dotted reference shows the majority-class baseline.
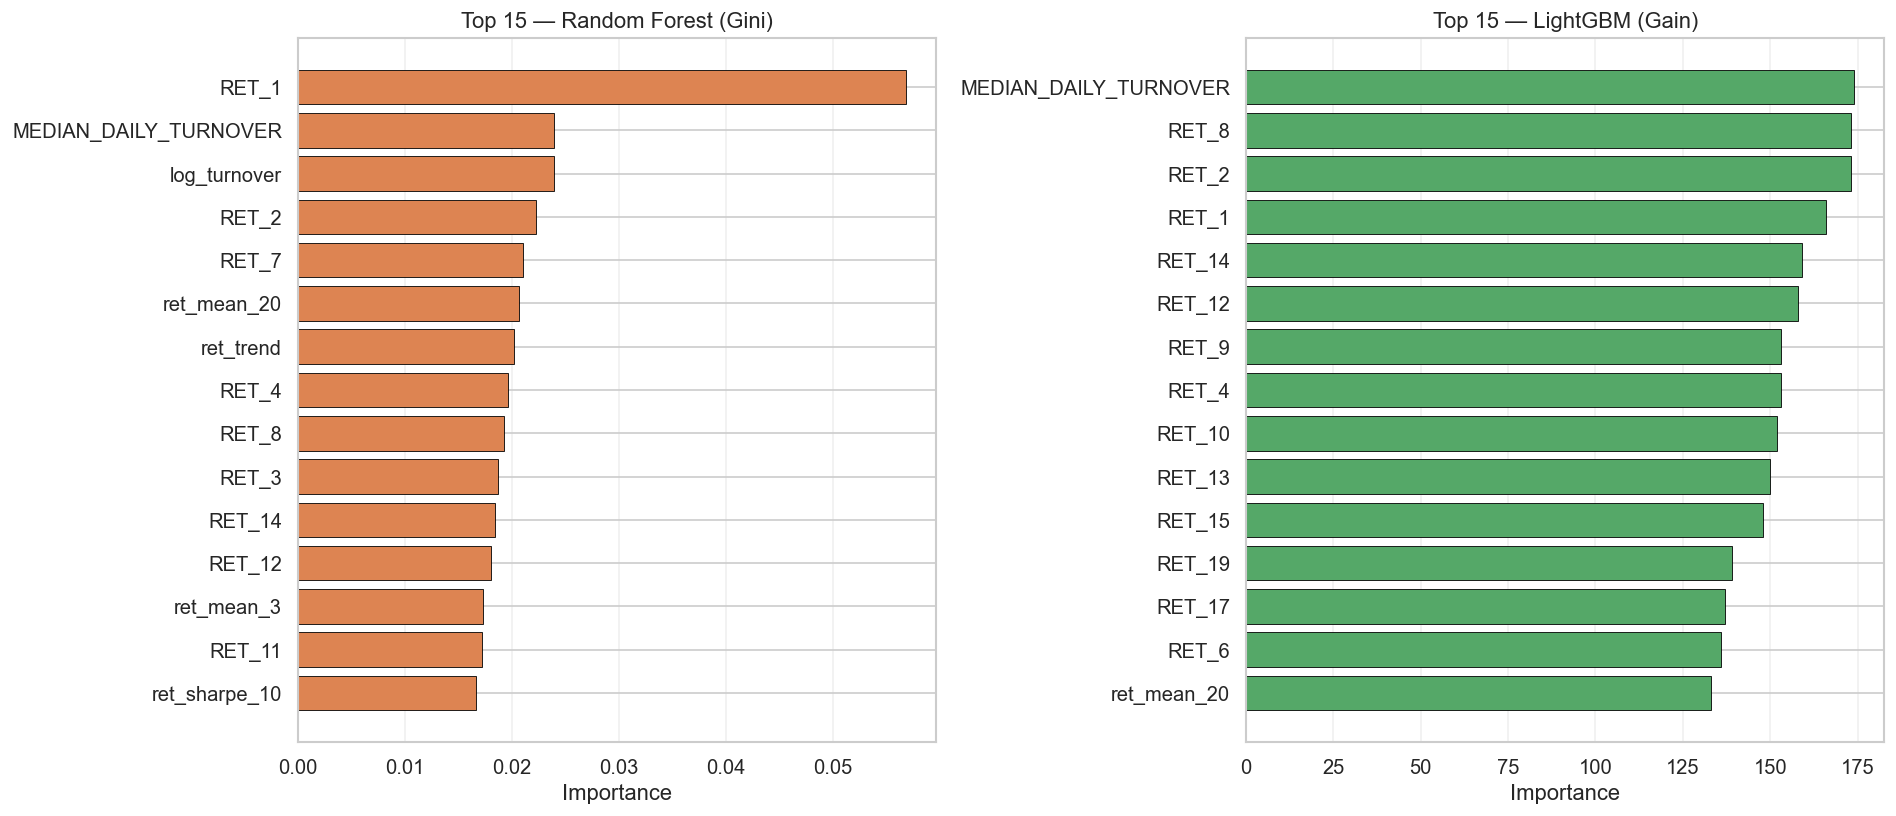
RET_1, RET_2, RET_8 and median daily turnover repeatedly rank among the strongest inputs.
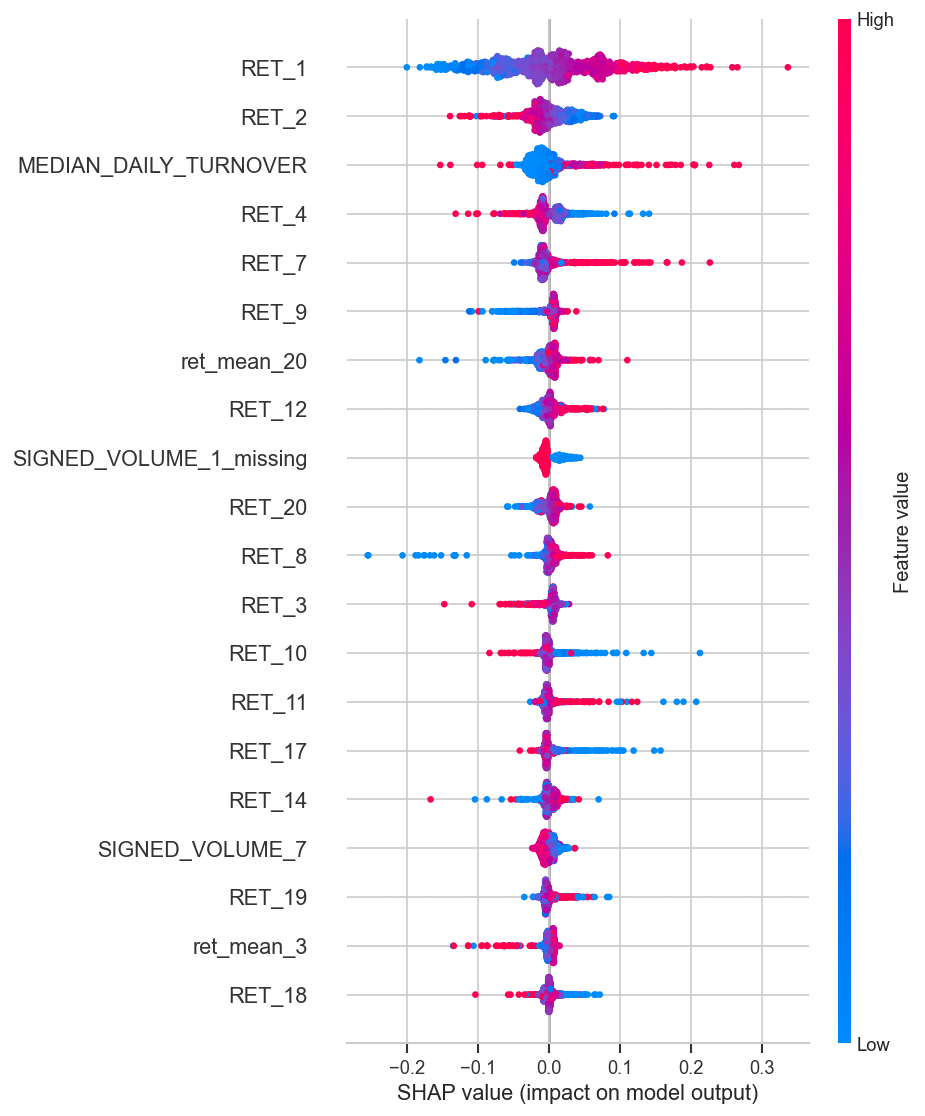
The explanation layer makes nonlinear effects visible instead of treating a small accuracy gain as a black box.
MODEL CHOICE
LightGBM reached 52.39% accuracy and 0.5313 AUC with a +0.0431 train-validation gap, versus +0.0837 for the slightly higher-scoring Random Forest.
LIMIT
The challenge metric is classification accuracy. Turnover, execution costs, portfolio construction and economic capacity remain outside this evaluation.